Matlab绘制子图subplot使用详细方法介绍
Matlab绘制子图subplot使用操作方法

情况1:子象限中的子图
subplot的功能:
子图将当前数字划分为按行编号的矩形窗格。 每个窗格都包含一个轴对象,您可以使用轴属性来操作它们。 随后的图被输出到当前窗格。
h =subplot(m,n,p)
m 代表行
n 代表列
p 代表的这个图形画在第几行、第几列。
subplot的使用方法:
h =subplot(m,n,p)
将数字窗口分成m×n的网格,
并在当前图的第p个位置创建一个轴对象,并返回轴句柄。
坐标轴沿着图形窗口的第一行,然后是第二行等。
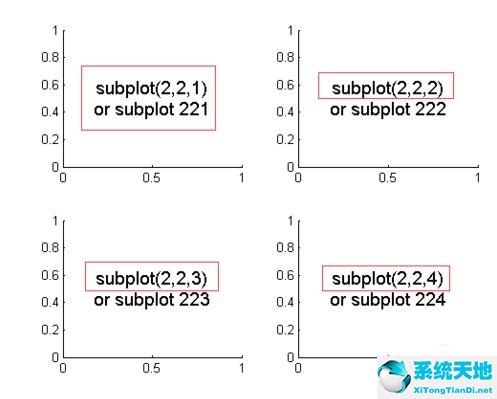
例如 subplot(2,2,1)
表示一个2行2列的画布上,你用第一行第一列画图。
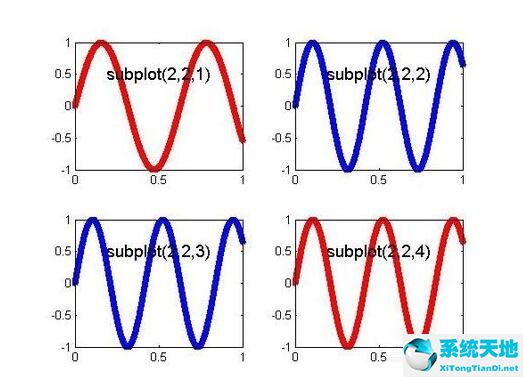
例如:复制一下程序到Matlab窗口
figure
t=0:0.001:1;
y1=sin(10*t);
y2=sin(15*t);
y3=sin(20*t);
y4=sin(25*t);
subplot(2,2,1)
plot(t,y1,'--r*','linewidth',2,'markersize',5)
text(.5,.5,{'subplot(2,2,1)'},...
'FontSize',14,'HorizontalAlignment','center')
subplot(2,2,2)
plot(t,y2,'--b*','linewidth',2,'markersize',5)
text(.5,.5,{'subplot(2,2,2)'},...
'FontSize',14,'HorizontalAlignment','center')
subplot(2,2,3)
plot(t,y2,'--b*','linewidth',2,'markersize',5)
text(.5,.5,{'subplot(2,2,3)'},...
'FontSize',14,'HorizontalAlignment','center')
subplot(2,2,4)
plot(t,y2,'--r*','linewidth',2,'markersize',5)
text(.5,.5,{'subplot(2,2,4)'},...
'FontSize',14,'HorizontalAlignment','center')
程序编译结果如图所示
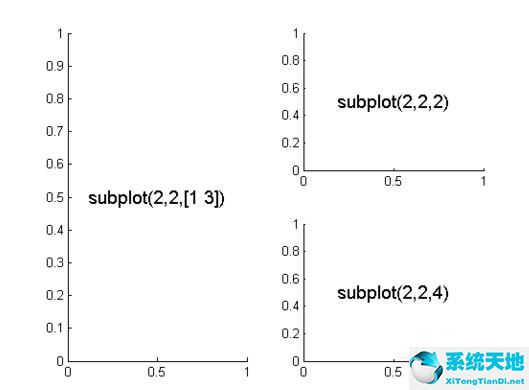
情况2:不对称的子图
以下组合产生子图的不对称排列。如图所示
subplot(2,2,[1 3])
text(.5,.5,'subplot(2,2,[1 3])',...
'FontSize',14,'HorizontalAlignment','center')
subplot(2,2,2)
text(.5,.5,'subplot(2,2,2)',...
'FontSize',14,'HorizontalAlignment','center')
subplot(2,2,4)
text(.5,.5,'subplot(2,2,4)',...
'FontSize',14,'HorizontalAlignment','center')
程序编译结果如图所示
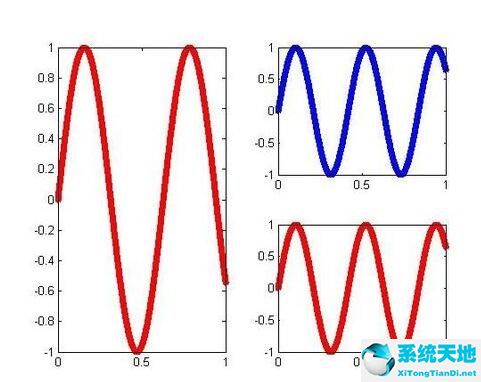
例如:复制一下程序到Matlab窗口
figure
t=0:0.001:1;
y1=sin(10*t);
y2=sin(15*t);
y3=sin(20*t);
y4=sin(25*t);
subplot(2,2,[1 3])
plot(t,y1,'--r*','linewidth',2,'markersize',5)
subplot(2,2,2)
plot(t,y2,'--b*','linewidth',2,'markersize',5)
subplot(2,2,4)
plot(t,y2,'--r*','linewidth',2,'markersize',5)
程序编译结果如图所示
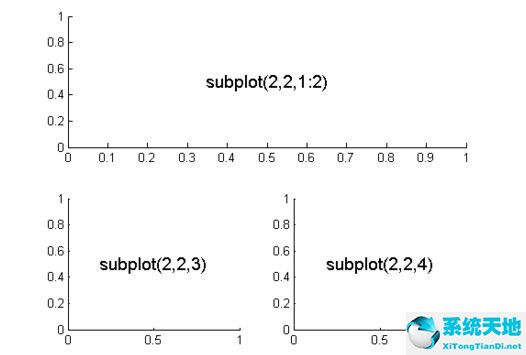
以下组合产生子图的不对称排列。如图所示
subplot(2,2,1:2)
text(.5,.5,'subplot(2,2,1:2)',...
'FontSize',14,'HorizontalAlignment','center')
subplot(2,2,3)
text(.5,.5,'subplot(2,2,3)',...
'FontSize',14,'HorizontalAlignment','center')
subplot(2,2,4)
text(.5,.5,'subplot(2,2,4)',...
'FontSize',14,'HorizontalAlignment','center')
程序编译结果如图所示
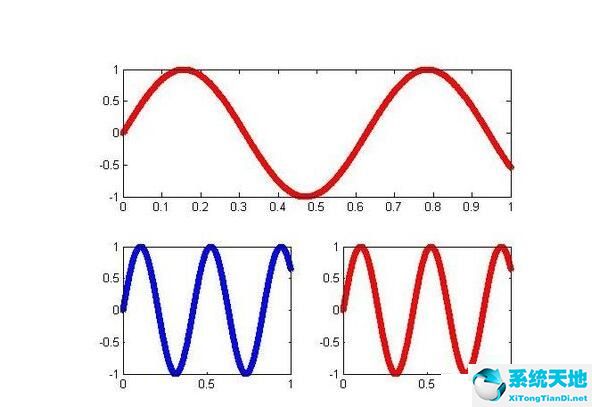
例如:复制一下程序到matlab窗口
figure
t=0:0.001:1;
y1=sin(10*t);
y2=sin(15*t);
y3=sin(20*t);
y4=sin(25*t);
subplot(2,2,[1 2])
plot(t,y1,'--r*','linewidth',2,'markersize',5)
subplot(2,2,3)
plot(t,y2,'--b*','linewidth',2,'markersize',5)
subplot(2,2,4)
plot(t,y2,'--r*','linewidth',2,'markersize',5)
程序编译结果如图所示
上面就是小编为大家讲解的Matlab绘制子图subplot使用操作内容,一起来学习学习吧。相信是可以帮助到一些新用户的。


 苏公网安备32032202000432